


Richard Sternberg

Here’s a Far from Exhaustive (Yet Still Exhausting) List of Papers Discovering Function for “Junk” DNA
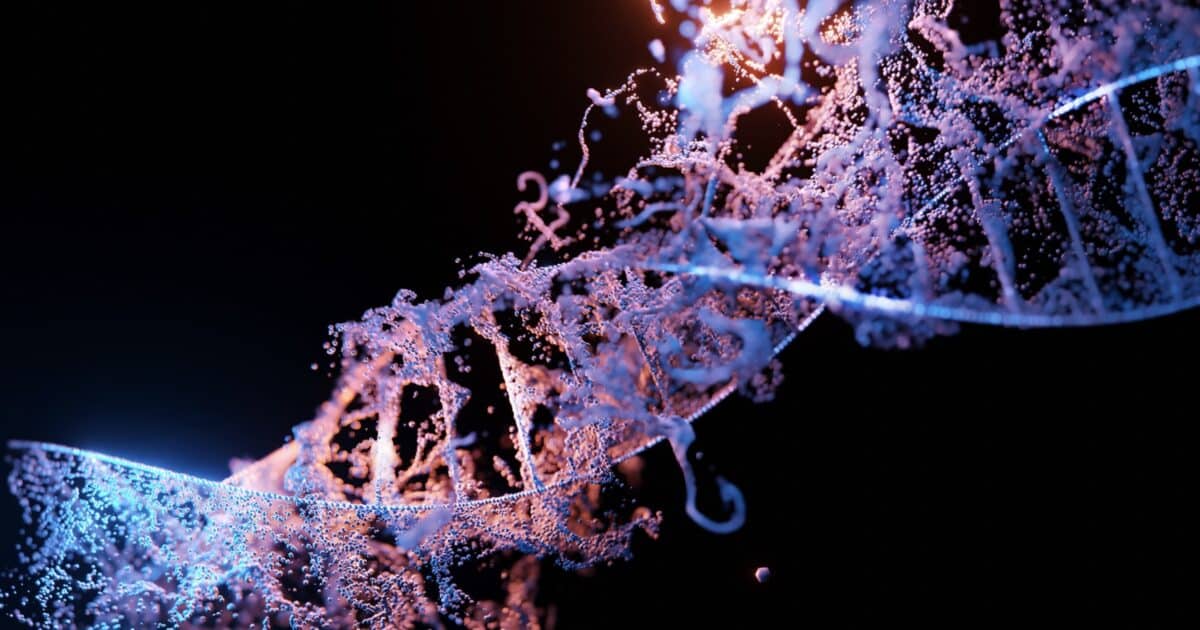
DNA May Be “Junk” at One Level But of Utmost Significance at Another
Chromosome Dynamics Has Egg-centric Features
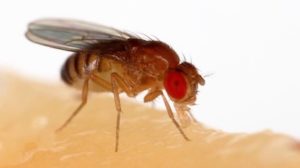
The “Why” of the Fly “Y”: Reflections on “Junk” DNA

Limited-Time Offer! Act Now! Operators Standing By! MagiMold™!

Let’s Do the Math Again
Earlier today I criticized Calvin College biologist Steve Matheson’s incorrect view of “junk” DNA. Matheson had argued in February that the human genome contains about 190,000 introns (stretches of non-protein-coding DNA that interrupt protein-coding genes), of which “only a handful” had important functional roles. “How many? Oh, probably a dozen,” he wrote, “but let’s be really generous. Let’s say that a hundred introns in the human genome are known to have ‘important functional roles.’ Oh fine, let’s make it a thousand.” On the contrary, I pointed out that at least 90% of genes are alternatively spliced, meaning that 0.9 x 190,000 = 171,000 introns are involved in alternative splicing, an essential process that helps to ensure that the proper proteins Read More ›
Matheson’s Intron Fairy Tale
The failure to recognize the importance of introns “may well go down as one of the biggest mistakes in the history of molecular biology.” –John Mattick, Molecular biologist, University of Queensland, quoted in Scientific American On Friday, May 14, I watched as Steve Meyer faced his critics — two of them anyway, Art Hunt and Steve Matheson — at Biola University in Los Angeles. Matheson had previously claimed that Meyer misrepresented introns in his book, Signature in the Cell. (Introns are non-protein-coding sequences of DNA that occur within protein-coding regions.) In a blog post dated February 14, Matheson had accused Meyer of “some combination of ignorance, sloth, and duplicity” for stating in his book that although introns do not encode Read More ›
Beginning to Decipher the SINE Signal
Remember the analogy of the two moons I used yesterday to discuss the distribution of SINEs in the mouse and rat genomes? Well, I am going to use it again today, but only for a moment.
Moon Mysteries and the Lunarlogos Foundation
Suppose you are keenly interested in the topography of one of the moons, named Y6-9. Suppose also that the books you first select to read on the topic are popular works, written by “experts” who are “living legends.” As you read through the works, you find paragraphs here and there about how utterly decrepit Y6-9 is, and how this space body exemplifies eons of random events. The authors argue that we already knew all there was to know about that moon back in 1859, and that the evidence demonstrates either that God doesn’t exist or that the deity left the cosmos to itself after the Big Bang.
You find, however, that these books almost totally ignore the findings of the billion-dollar missions sent to the surface of Y6-9 since the 1960s. Indeed, there is next to nothing in them about Y6-9’s actual geology.
So you contact the Lunarlogos Foundation, a Christian group that promotes such books. You tell them that you have a few specific questions about the Y6-9 mission findings. The response you get is that because you are a layman, you would not be able to comprehend the details. Besides, the Lunarlogos folks say, the mainstream experts have spoken authoritatively about the subject and that should be enough for you. As a consolation, though, they send you a CD that has songs that are sung by one of their founding members.
Read More ›Discovering Signs in the Genome by Thinking Outside the BioLogos Box
Yesterday I promised that I would show you a mysterious genomic signal, and today I shall fulfill that promise. The previous blog was devoted to describing the linear distribution of LINEs and SINEs along mammalian chromosomal DNA. We saw that L1 retrotransposons tend to be densest in the regions where Alus and Alu-like elements are the least common and vice versa. I included the following figure from an article co-authored by Francis Collins1 that showed this compartmentalization of LINEs and SINEs along over a hundred million genetic letters of rat chromosome 10:
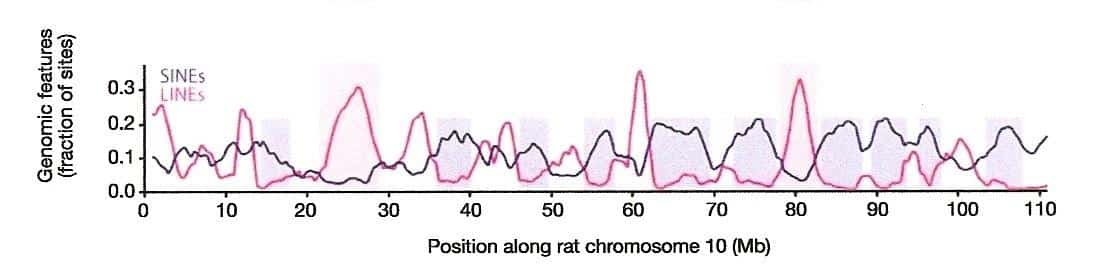
The blue line indicates the distribution of SINEs along a 110-million base pair interval of rat chromosome 10. (From Fig. 9d of Ref. 1.)
Taxon-Specific Elements: The SINEs Aren’t The Same
Intriguing as this non-random distribution of repetitive elements may be, it gets even more interesting when one realizes that SINEs are specific to taxonomic groups. Each primate genome has distinct subfamilies of the Alu sequence. The mouse genome, on the other hand, has no Alus but it does have three unique SINE families called B1, B2, and B4. While mouse B1 shares some sequence similarity with Alu, it has no relationship to the B2 or B4 elements; the latter two are also unrelated to each other. What then about the rat SINEs along chromosome 10, which were depicted as a blue line? Well, the genome of the rat has one main SINE family called ID, for the “Identifier” sequence. The ID elements have nothing in common at the DNA sequence level with the mouse B1s, B2s, or B4s, and they are wholly dissimilar to Alus.
Read More ›